Finland makes our buses look crap, as well as our phones. “Every bus and tram in Helsinki and the surrounding cities of Vaanta and Espoo are being fitted with Linux servers and GPS units. Every bus and tram in the conurbation will not only become a wireless hotspot serving broadband internet throughout the vehicle — for free — but every bus and tram is visible on a Google map (the beta version is at tinyurl.com/2gftso) that uses the same real-time passenger information as the controllers in their command centre.” Hat-tip to Guy Beres.
Lessons from tacky Heath Ledger jokes, final edition
It’s nearly a month since I posted my tacky Heath Ledger joke page. What have we learned? Truth be told, not a lot more than I wrote in the Day 1 lessons and the items tagged “heath ledger”.
But let’s look at the total traffic anyway, this time using a graph from Google Analytics which shows visits only visitors to the jokes page.

As of just now, there’s been 11,717 page views in total, representing 8,798 unique visitors who stayed on average for 3 mins 44 secs per visit — quite respectable!
Traffic took a couple of days to peak — the first day being fuelled by Google Adwords — with a secondary peak the following week when Ledger’s funeral arrangements hit the news. Google rates the peaks as about 1000 visits a day and even now, a month later, we’re still seeing 60 to 80 visits a day.
As for the jokes themselves, well… to be honest I really don’t want to read them again. Most of them were crap. If you’ve got any astounding sociological observations, feel free to post a comment.
Who owns what on the Internet
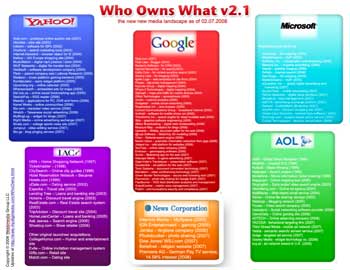
Amy Webb (now there’s an aptonym!) has updated her diagram of who owns the new media landscape. It’s also available as a PDF file.
Coming soon, a widget and RSS feed to help you track acquisitions and mergers in media.
I must admit, I’d much rather see this sort of data presented as a directed graph of ownership relationships, rather than simple lists — something like this diagram. The size of the nodes could represent the companies’ market capitalisation, and width of the lines the percentage ownership or something.
Still, it’s a handy-enough reference.
Hat-Tip to Lee Hopkins.
Heath Ledger spikes my website, Day 9

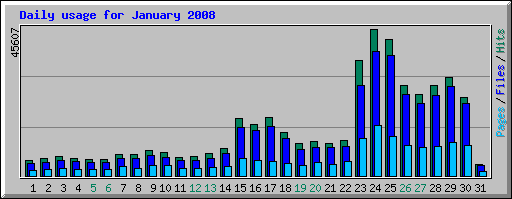
Well unless Heath Ledger is in the news again for some reason, apart from the routine news about his funeral etc, I think the steady decline seen in the traffic over the last three days will continue.
As with the Steve Irwin jokes, though, the traffic will never fade away completely. There’ll always be some level of searching for “heath ledger jokes”, and occasional surges as he enters the news.
There’s today’s graph for now. More detailed analysis and reflection later.
Heath Ledger spikes my website, Day 8

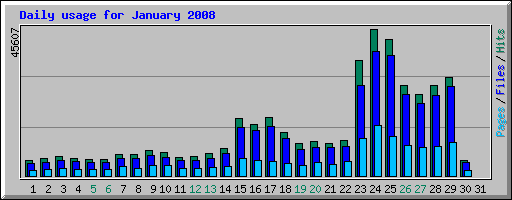
Given that there’s quite a bit of fluctuation in web traffic from day to day anyway — for all manner of reasons — I’m going to say that it’s been relatively steady through the week so far.
As I mentioned yesterday, the Heath Ledger jokes page is now sustaining itself on Google search results. I think I’ll do a more detailed end-of week analysis tomorrow. I just wanted to publish something about this Experiment today because I know every single reader is awaiting my every word on this important global issue.
Heath Ledger spikes my website, Day 7

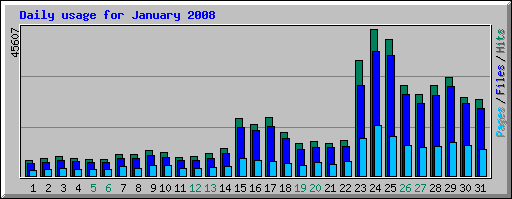
Another day, another traffic graph for The Heath Ledger Experiment. And once more, contrary to my expectations, there’s another gentle increase in traffic.
Could this be because the Heath Ledger jokes page is now the top result when you do a Google search for “heath ledger jokes”?
Today is about other things for me, not Mr Ledger, so I’ll return to these thoughts tomorrow. But do feel free to add your own comments.

