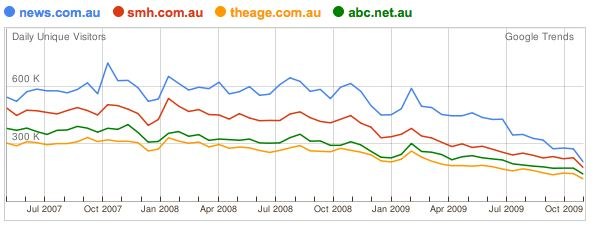
Yesterday I wrote an article for Crikey plus a post here based on Google Trends data which, it now appears, is dodgy.
Google Trends shows a steady decline in traffic to various websites since about September 2008, based on the metric “unique daily browsers”. But I was howled down. Everyone else’s metrics were not showing such a decline.
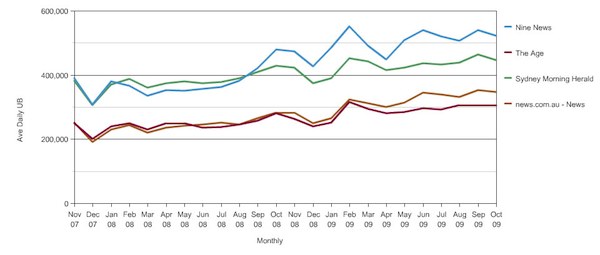
Indeed many, such as this chart of Nielsen NetRatings’ unique dailies, provided by Andrew Hunter (@Huntzie), Head of News, Sport and Finance at ninemsn, showed the exact opposite.
For example, news.com.au grew from 250,829 average daily unique browsers (UBs) in July 2008 to 346,367 in October 2009, a 38% increase. Not the roughly 50% drop shown by Google Trends.
Google says:
Trends for Websites combines information from a variety of sources, such as aggregated Google search data, aggregated opt-in anonymous Google Analytics data, opt-in consumer panel data, and other third-party market research. The data is aggregated over millions of users, powered by computer algorithms…
In other words, it’s some Google Secret Sauce. But has the sauce gone off?

The Google Trends forum is rather quiet. There were only three questions or comments posted for the whole of September, none of which received a reply, and nothing since. I can’t see that anyone from Google has responded to anything for months and months — I gave up looking back any further. Others have noted that Google Trends data differs wildly from Google’s own Analytics product — usually complaining that it shows significantly less traffic.
Google Trends is a Google Labs product, i.e. an experiment, I’m starting to think that it’s been abandoned and we’re just seeing a slow degradation due to lack of maintenance.
Meanwhile, I have changed my Twitter avatar to a goose for the rest of today.


