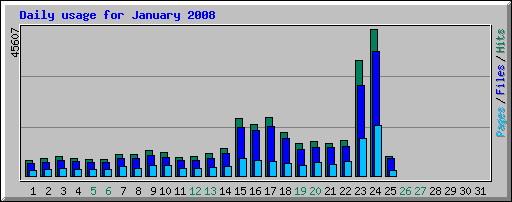
OK, I clearly know nothing about the Internet. Website traffic has actually gone up since yesterday!

Don’t worry about that number in the corner of the graph. That’s “hits” which includes all the images and little bits of JavaScript in each page.
Using another analysis tool, the number of unique visitors to the site each day (once search robots and hack attempts are filtered out) has risen from around 500 a day before Corey Worthington Delaney to more than 900 after Mr Socialite graced the world with his presence, to 1402 on Heath Ledger Day 1, to 1807 yesterday.
So what’s going on here?
Well, it’s certainly all about Heath Ledger.
The Heath Ledger jokes page has received 2618 human visitors in total, which roughly matches the increase in traffic. Originally that traffic was generated by advertising on Google. But now it’s all from what’s called “organic search” — that is, we’re turning up naturally in search results rather than paying for it.
Here’s the top 10 searches which have brought people here so far this month, showing the number of human visitors and the percentage of search-generated traffic that represents.
search phrase views % of searches heath ledger jokes 598 12.2 % corey delaney 525 10.7 % heath ledger dead jokes 271 5.5 % heath ledger 171 3.5 % jokes about heath ledger 106 2.1 % heath ledger death jokes 99 2 % heath ledger joke 94 1.9 % corey worthington delaney 91 1.8 % stilgherrian 85 1.7 % steve irwin jokes 79 1.6 % Other phrases 2749 56.4 %
Now I know that for a few hours I was Google’s number 4 result for “heath ledger dead joke”, but that soon passed as mainstream media mentions of The Joker built up. Just now, I’ve looked at Google’s results for “heath ledger jokes” and I’m nowhere in the first 35 pages of results. So I’m guessing those hits all came from the paid advertising.
[Yes, I should right-justify the numbers in those columns, but you’re all smart enough to figure it out for yourselves, I’m sure. I’ll do the rest of the tables the same way.]
Looking specifically at the jokes page, here’s how Google Analytics reckons the visitors found us.
source views uniques time on page 947 449 0:04:01 (direct) 105 78 0:04:43 facebook.com 31 26 0:01:16 google.com.au 7 7 0:02:55 messaging.myspace.com 4 3 0:13:59 twitter.com 4 4 0:03:01 google.com 2 2 0:00:00 aol 1 1 0:00:00 tailrank.com 1 1 0:00:00 technorati.com 1 1 0:00:00
The numbers don’t match the other charts, so I suspect some people arrived at the home page first, rather than directly to the jokes page.
Some observations about these numbers:
- People spending 3 or 4 minutes on a web page is pretty respectable. Most websites have people flit in and out much faster. These visitors were engaging with the content!
- Posting a link on Facebook was worth it. About a third of my friends clicked through. Are they desperate, or losers?
- The 3 unique visitors that arrived via messaging.myspace.com intrigue me, since they spent much longer on site. I wonder if they’re the same three guys who all came from the same Internet domain, a business in the US, and posted lots and lots of comments? Didn’t they have any work to do?
I’ll continue poking at the numbers… more soon.

I think you are going too far to suggest your Facebook friends are “desperate, or losers.”
We are “desperate losers,” no “or” required
S
I leave this page open all day and pop back in periodicially to check on the latest jokes. Wonder if that is spiking your numbers on “time spent”, or if I am the odd case.
@Simon Slade: A very astute observation, thank you. 🙂
@muppet: You (and anyone else doing the same) could well be causing that spike. Google Analytics embeds JavaScript code in the page which clocks when you first open the page and when you eventually leave it — either by navigating to another page or closing the window. If you leave the page open all day it could well cause an outlier data point which skews that average figure.