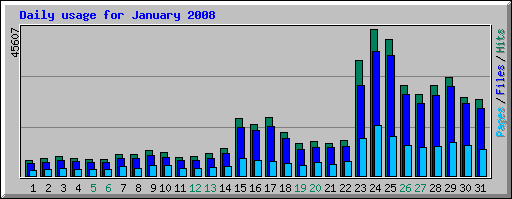
Well unless Heath Ledger is in the news again for some reason, apart from the routine news about his funeral etc, I think the steady decline seen in the traffic over the last three days will continue.
As with the Steve Irwin jokes, though, the traffic will never fade away completely. There’ll always be some level of searching for “heath ledger jokes”, and occasional surges as he enters the news.
There’s today’s graph for now. More detailed analysis and reflection later.

So are we looking at the light blue, or the dark blue?
There was something in the news last night, about some video that was purchased with something or other on it from 2 years ago. I wasn’t paying much attention clearly but he did make the news again, and the fron page of some paper which I picked up also. I’m really unobservant, and I apologise
@Rhys: Good question. The short answer is that it’s all bullshit, because the graph shows total traffic to this website, not just the traffic to the Heath Ledger jokes page. However, since that traffic dominates the site at the moment, it’ll do as an approximation.
The light blue shows “pages” viewed, which is the more accurate measure. The dark blue shows “files” which depends. A page with three included graphics plus some JavaScript is 5 files: one for the page plus one for each of the other elements.
When I post my more detailed analysis, I will use Google Analytics and my own software to isolate the data just for the jokes page.